 keymodels
BCG matrix
How can bcg matrix support strategic choice or positioning?
Contents
The Boston Consulting Group designed the ‘BCG matrix’ in the 1970s.
The Boston Consulting Group (BCG) created the growth–share matrix around nineteen seventy. One of the best-known portfolio-planning tools, it connects product life-cycle logic with two variables: market growth and relative market share. Its central premise is that a resilient portfolio combines high-growth businesses that consume cash with established, slower-growth businesses capable of generating surplus cash.
When to use it
Use the BCG matrix to compare the growth and profit potential of business units or products. Classifying each position supports a choice to build, hold, harvest or divest and helps management shape the overall portfolio into a financially sustainable mix.
Origins
BCG founder Bruce Henderson developed the growth–share matrix at the end of the 1960s, and the firm published the framework around nineteen seventy. It drew on BCG’s experience-curve research, which linked accumulated output with declining unit cost, and on the observation that fast-growing businesses require investment while mature leaders can release cash.
What it is
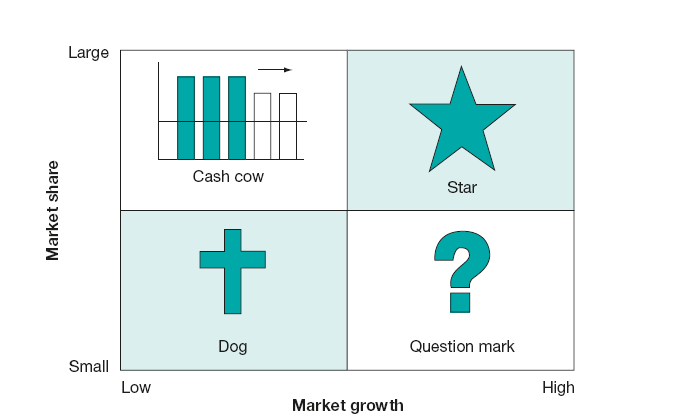
The matrix establishes growth priorities by plotting each product or business on two axes: relative market share and market growth. The resulting position falls into one of four categories—stars, cash cows, question marks and dogs. Management then allocates capital towards opportunities that can create economic growth while drawing funding from positions that generate more cash than they need.
How to use it
First, estimate the expected market-growth rate for every product or service in scope. Then calculate relative market share, normally by comparing the product’s share with that of the largest competitor. Plot each offer against the two axes using a consistent set of thresholds.
The boundaries inevitably involve judgement, particularly when positions differ only slightly, so define the criteria before reviewing individual products. A company might classify share as low when it is less than one-third of the largest competitor’s and call growth high when inflation-adjusted annual revenue exceeds 10 per cent. Keep the rules fixed during classification. If thresholds move to rescue favoured products, the exercise loses its value.
- Stars hold a high relative share in a rapidly growing market. They may already be profitable but usually need continued investment to defend and extend their position.
- Cash cows combine high, stable share with lower market growth. They require limited incremental investment and can generate cash to fund other portfolio positions.
- Question marks operate in high-growth markets but hold low share. Investment might turn them into leaders or might fail to produce an adequate return, so investigate the source and economics of potential advantage before committing.
- Dogs combine low share with low growth. Divest or discontinue those that destroy value. If a dog remains profitable, limit new investment and harvest its current value, potentially including a sale of operations or the brand.
Do’s
- Reassess the portfolio periodically and decide explicitly which positions warrant investment.
- Monitor changes in market definition, growth and competitor share.
Don’ts
- Do not preserve an unprofitable dog solely because it has historical or political support.
Final analysis
The model’s assumptions are contestable. Markets are not always easy to define, share does not necessarily predict cash generation and rapid growth does not guarantee that additional capital will produce a larger future payoff. Investment alone cannot make a weak product grow or become profitable. The matrix is valuable because it forces portfolio choices, but it should never determine market strategy by itself.
Relative share is generally more informative than absolute share, but the calculation still depends on a defensible market boundary. A “market” may contain distinct segments and substitutes, and its supply may be concentrated or dispersed among many small participants. In immature markets, growth and share may not yet have stabilised enough to justify the matrix’s strongly positive or negative labels.
Top practical tip
Define the market, the comparison competitor and the growth threshold before plotting products. Consistent boundaries make the portfolio discussion more credible and less vulnerable to internal bias.
Top pitfall
Do not infer that a question mark deserves investment simply because its market is growing. Capital creates value only when the business has a credible route to advantage, share and attractive returns.
Further reading
Boston Consulting Group (1970) Product Portfolio Matrix, BCG.
Hambrick, D.C., MacMillan, I.C. and Day, D.L. (1982) ‘Strategic attributes and performance in the BCG Matrix – A PIMS-based analysis of industrial product businesses’. The Academy of Management Journal 25(3), 510–531.
Henderson, B. (1968) ‘The product portfolio’. BCG Perspectives, 66.
Henderson, B. (1973) ‘The experience curve reviewed: IV the growth share matrix or product portfolio’. BCG Perspectives, 135.