 keymodels
MABA analysis
How can maba analysis support strategic choice or positioning?
Contents
A MABA analysis compares the relative market attractiveness (MA) of a business activity or product–market combination with business attractiveness (BA), as determined.
MABA analysis compares the attractiveness of a market with the organisation’s ability to compete in it. It supports portfolio choices among product–market combinations by replacing a single growth or share indicator with weighted evidence on two composite dimensions.
When to use it
Use MABA to screen new opportunities, allocate scarce management attention and compare strategic positions. Market attractiveness may include size, growth, margin, stability, rivalry, regulation and bargaining power. Business attractiveness may include relative capability, brand, channels, cost position, fit, synergies and value-chain access.
Origins
MABA is a variant of the market-attractiveness/business-strength matrix developed by General Electric and McKinsey in the early nineteen-seventies. It extended the BCG growth–share matrix by using weighted factor sets and became widely known as a nine-box portfolio matrix. “Business attractiveness” here is equivalent to competitive strength, not a second measure of market appeal.
What it is
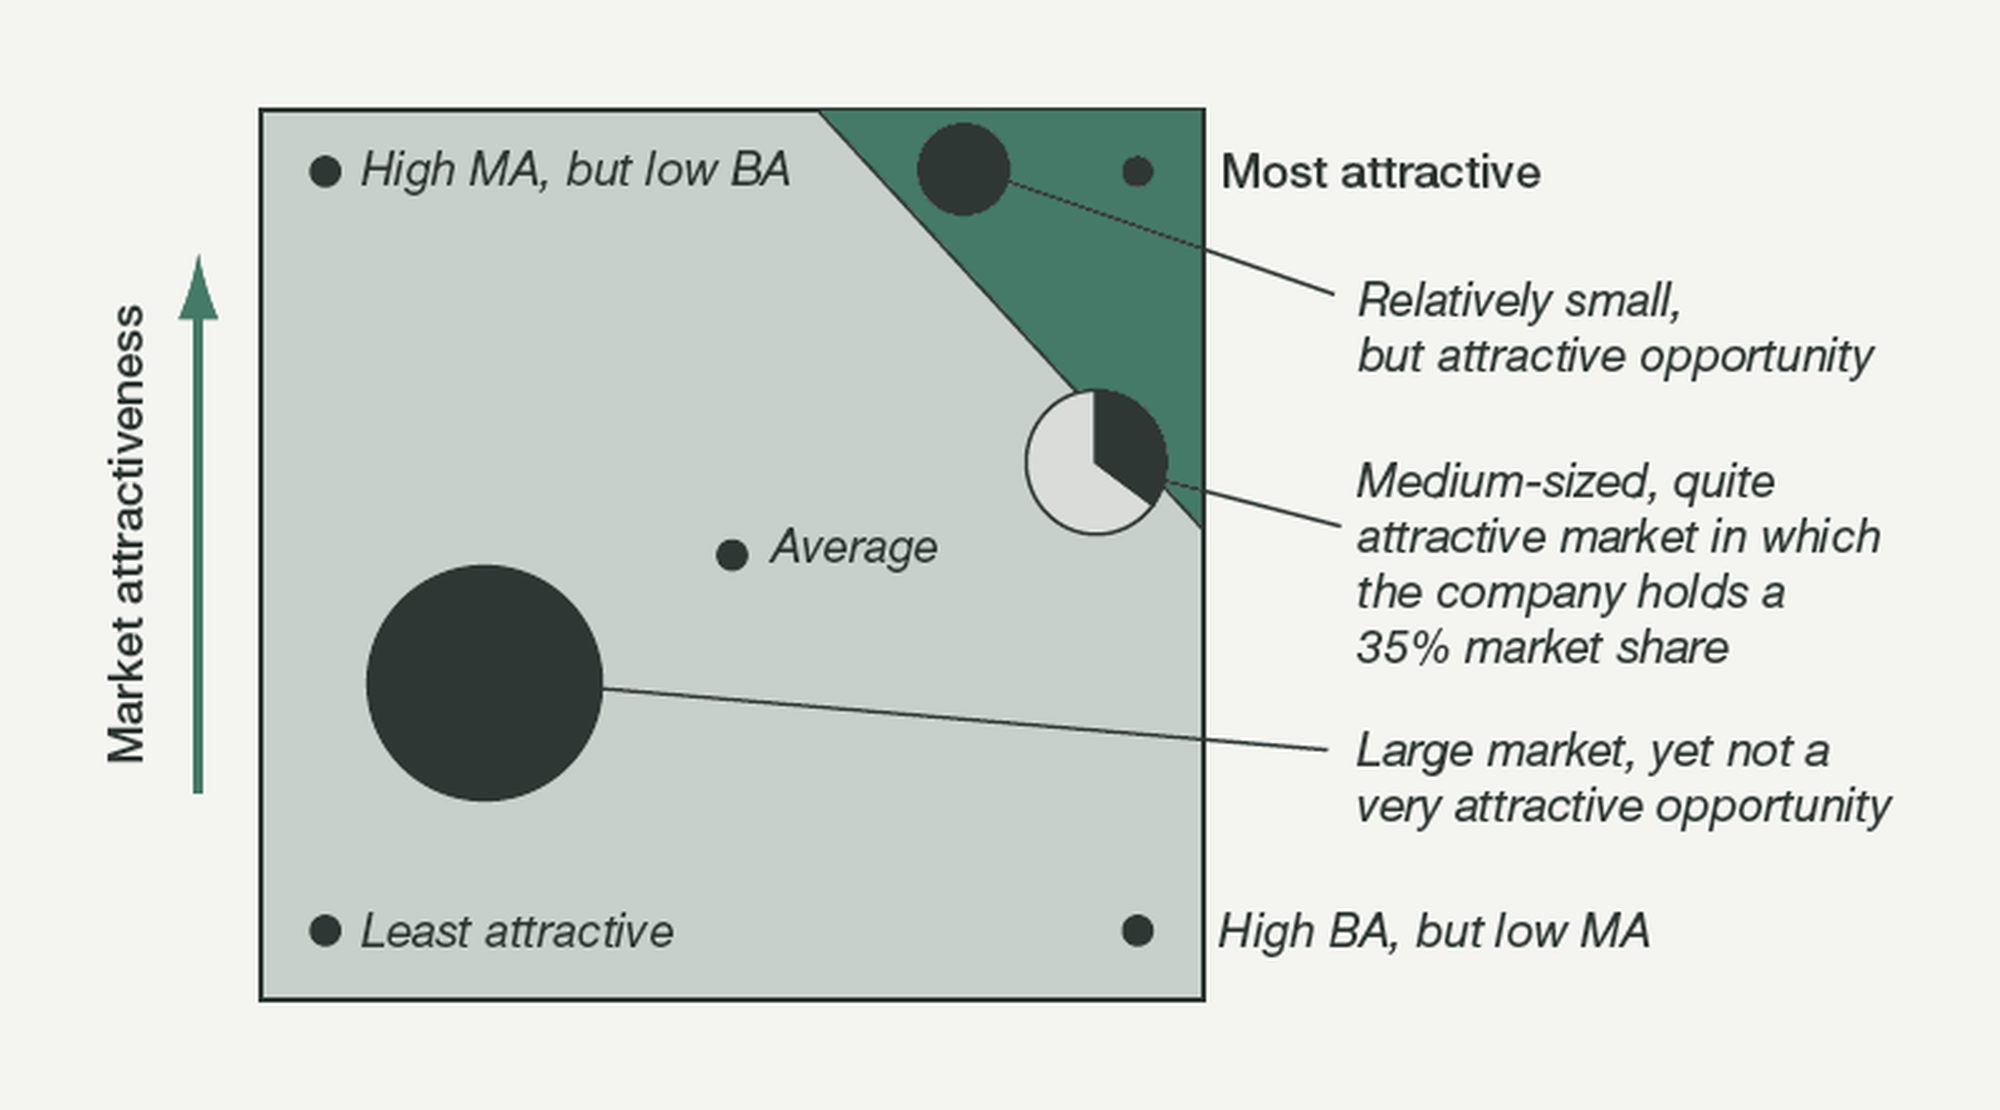
One axis scores external opportunity; the other scores the organisation’s relative position. Bubbles may show market size, revenue or capital at risk, and an internal segment may show market share. Zones commonly suggest invest/grow, selectivity or harvest/exit, but those labels require strategic interpretation.
Continue your preview
Read more of MABA analysis.
Create a free account to continue this advanced article preview. Complete access is available with Pro or an eligible outcome pack, so you can see the value before deciding to upgrade.