 keymodels
DuPont scheme
How can dupont scheme support strategic choice or positioning?
Contents
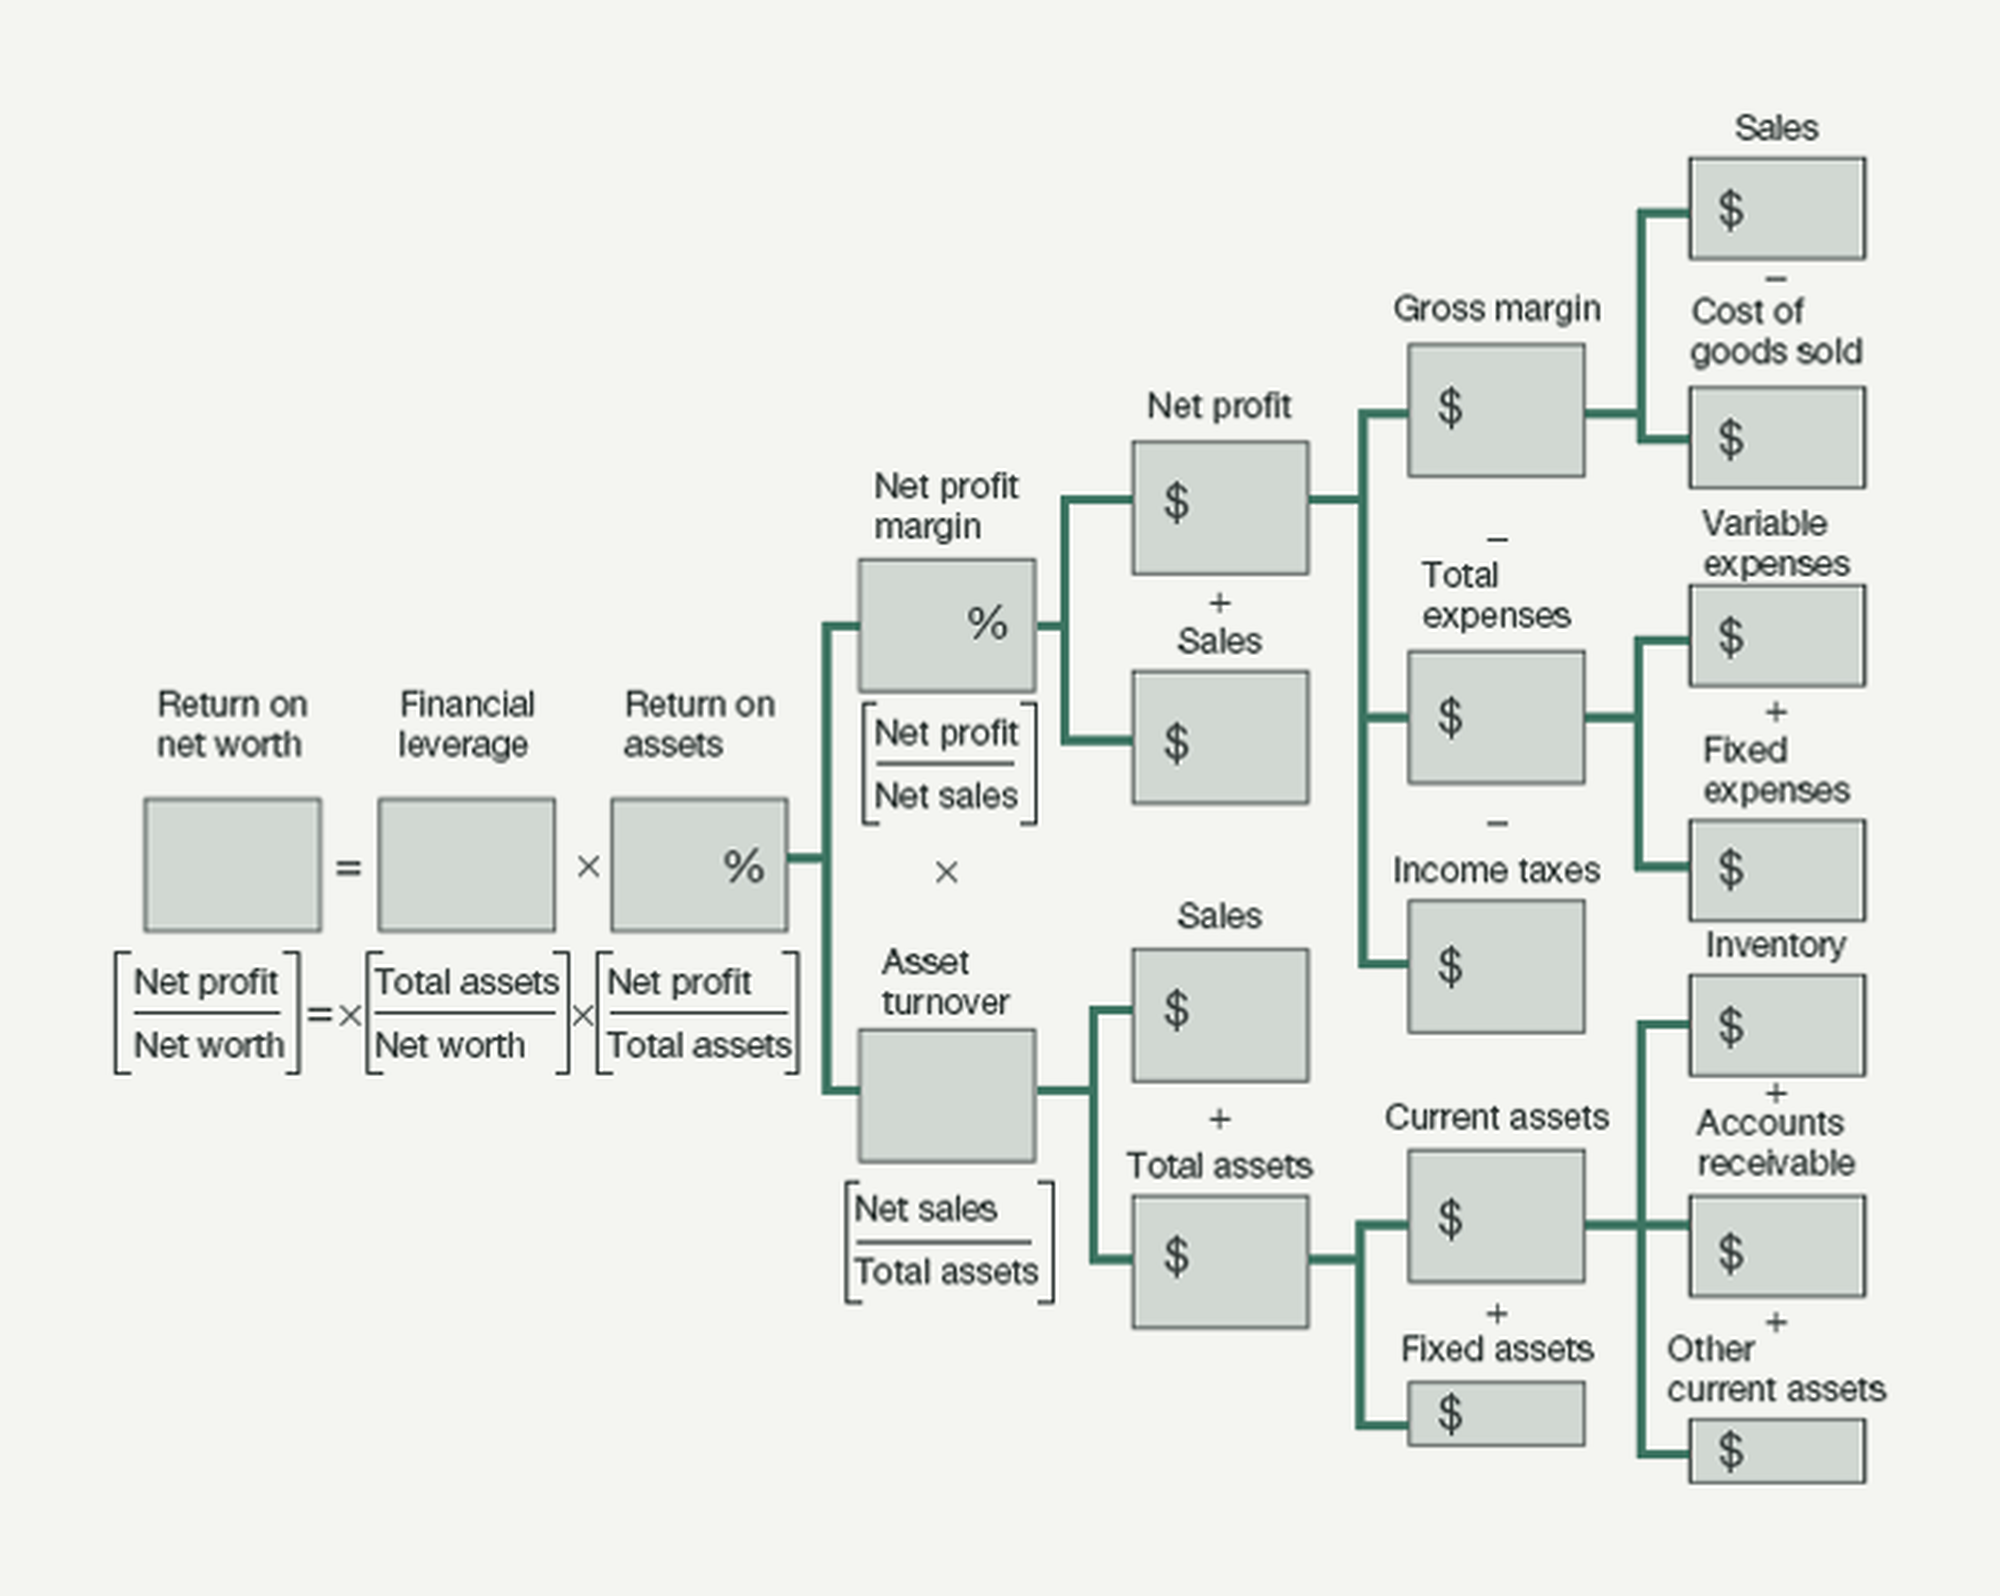
The DuPont scheme can be used to illustrate the impact that different factors have on important financial performance indicators, such as the return on capital employed.
DuPont analysis decomposes a headline return measure—such as return on capital employed, return on assets or return on equity—into the operating and financing drivers beneath it. Instead of knowing only that the return changed, management can see whether margin, asset use or leverage caused the movement.
When to use it
Use the scheme to benchmark comparable companies and explain why one earns a different return. It also supports scenario analysis by showing how a proposed change in price, cost, working capital, fixed assets or financing would flow through to the final ratio.
Interpret patterns by industry. Retailers may combine thin margins with rapid asset turnover, fashion businesses may rely more on margin and financial institutions may generate returns through leverage. Select peers with similar economics, accounting and risk.
- Operational efficiency
- Profit margin
- Capital efficiency
- Asset turnover × Equity multiplier
Origins
The scheme originated at E.I. du Pont de Nemours during the nineteen tens. Finance executive F. Donaldson Brown linked profit margin with asset turnover to explain return on investment, and DuPont adopted the method for internal performance analysis by nineteen nineteen. Brown later carried the approach to General Motors. Subsequent versions added financial leverage and, in expanded form, separated tax and interest effects.
What it is
The standard decomposition expresses return on equity as net profit margin multiplied by asset turnover and the equity multiplier. Margin reflects operating profitability, turnover reflects how efficiently assets generate revenue and the multiplier reflects financing leverage. An expanded version separates tax burden, interest burden and operating margin before asset turnover and leverage.
Because the components multiply, identical returns can arise from very different economics and risk. A high result created by strong operating performance is not equivalent to one created mainly by a thin equity base.
Continue your preview
Read more of DuPont scheme.
Create a free account to continue this advanced article preview. Complete access is available with Pro or an eligible outcome pack, so you can see the value before deciding to upgrade.