 keymodels
Root cause analysis/Pareto analysis
How can root cause analysis/pareto analysis improve people, teams, or organisational effectiveness?
Contents
Root cause analysis (RCA) is a class of problem-solving methods aimed at identifying the root causes of problems or events.
Root cause analysis (RCA) is a family of methods for explaining why an unwanted event or pattern occurred and identifying changes that can prevent recurrence. Pareto analysis helps prioritise categories by frequency, cost or consequence. A fishbone diagram helps organise possible causes. These tools complement one another, but none alone proves a root cause.
When to use it
Use RCA when a recurring defect, failure, delay, incident or outcome has material consequences and treating the symptom has not been sufficient. Scale the investigation to severity and learning potential.
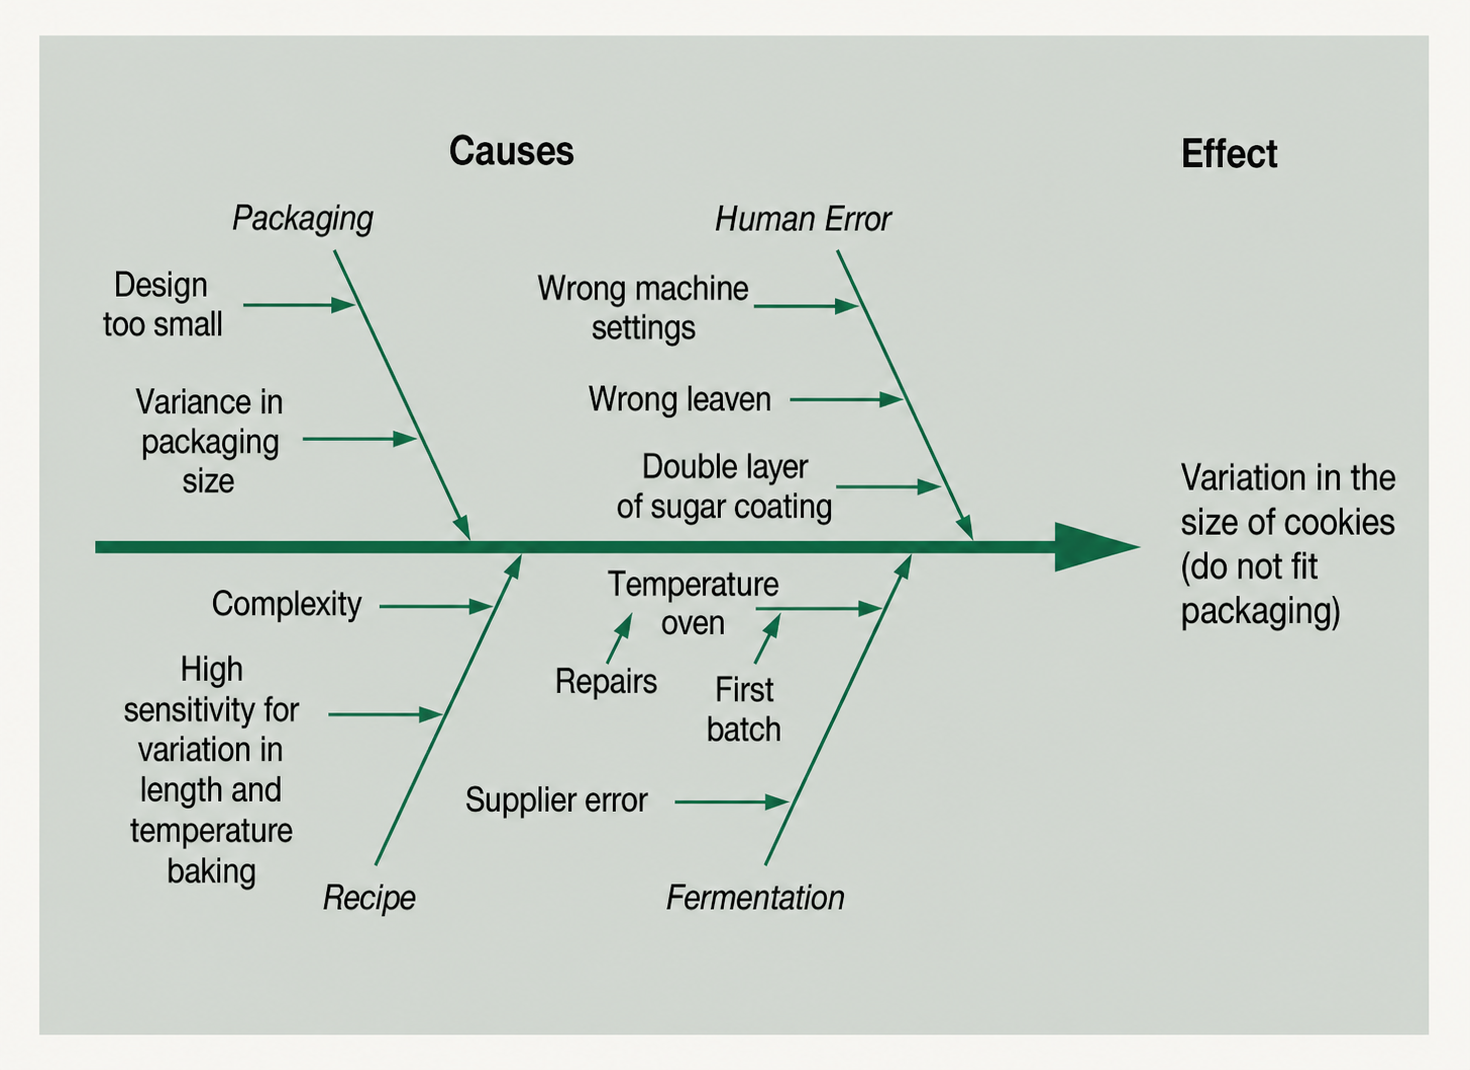
Use Pareto analysis when many categories compete for attention and a consistent measure can show where the largest share of effect occurs. Use a fishbone diagram early to widen causal inquiry across people, process, equipment, materials, environment, measurement and management-system factors.
Origins
RCA does not descend from one diagram. It draws on engineering failure analysis, quality management, safety investigation and systems thinking. Kaoru Ishikawa popularised the cause-and-effect or fishbone diagram in Japanese quality practice; it became widely used in the 1960s and is counted among the seven basic quality tools. Pareto charts derive from Vilfredo Pareto’s observations and Joseph Juran’s later application of the “vital few” idea to quality.
What it is
An RCA moves from a clearly defined event to evidence about causal mechanisms and control weaknesses. A root cause is not simply the last error in a chain or the person nearest the failure. It is a condition that, if changed, would materially reduce recurrence or consequence.
A fishbone diagram structures hypotheses; a Pareto chart ranks observed categories; process maps, timelines, change analysis, barrier analysis, interviews, tests and data analysis evaluate what actually happened. The output should distinguish confirmed causes, contributing conditions and unresolved hypotheses.
Continue your preview
Read more of Root cause analysis/Pareto analysis.
Create a free account to continue this advanced article preview. Complete access is available with Pro or an eligible outcome pack, so you can see the value before deciding to upgrade.