
keymodels
Menu
OperationsFramework / modelModelAccessible

Program Roadmap Diagramming

How can program roadmap diagramming support strategic choice or positioning?

AccessibleStrategicTeam1 min read
Contents

The graphical program roadmap can be (and not unusually is) implemented with a variety of tools such as spreadsheets, diagramming tools, scheduling tools.

A graphical program roadmap converts a long, interdependent delivery journey into a shared view of phases, milestones, benefits and workstreams. It can be built in a spreadsheet, diagramming application, scheduling platform or presentation tool. Each option trades data integration, visual quality, maintainability and ease of collaboration differently.

When to use it

  • Use the roadmap to communicate how major program outcomes, milestones and benefits unfold over time.
  • Align component teams, sponsors and governance bodies around sequencing, dependencies and decision points.
  • Adapt the structure as a working management artifact rather than treating it as a static presentation.

Context

The roadmap sits between strategy and detailed schedules. It should show enough structure to support governance without pretending to replace component plans. Tailor its time horizon, swim lanes, milestones, benefit markers, ownership and update cadence to the program’s lifecycle and stakeholder needs.

What it is

The following text artifact preserves the reference roadmap pattern and its illustrative milestone layout:
Program Roadmap Diagramming
The graphical program roadmap can be (and not unusually is) implemented with
a variety of tools such as spreadsheets, diagramming tools, scheduling tools, and
presentation tools. Each mode has advantages and disadvantages.
    It is always convenient when the graphic can be data driven, owing to the fact
that many updates can be sometimes made by changing underlying data without as
many tedious drawing requirements. Such is the allure of the spreadsheet approach.
Spreadsheets at this writing, however, generally do not provide the “plug-in” power
to translate into great diagrams, even though spreadsheets can drive presentation
tools and diagramming tools.
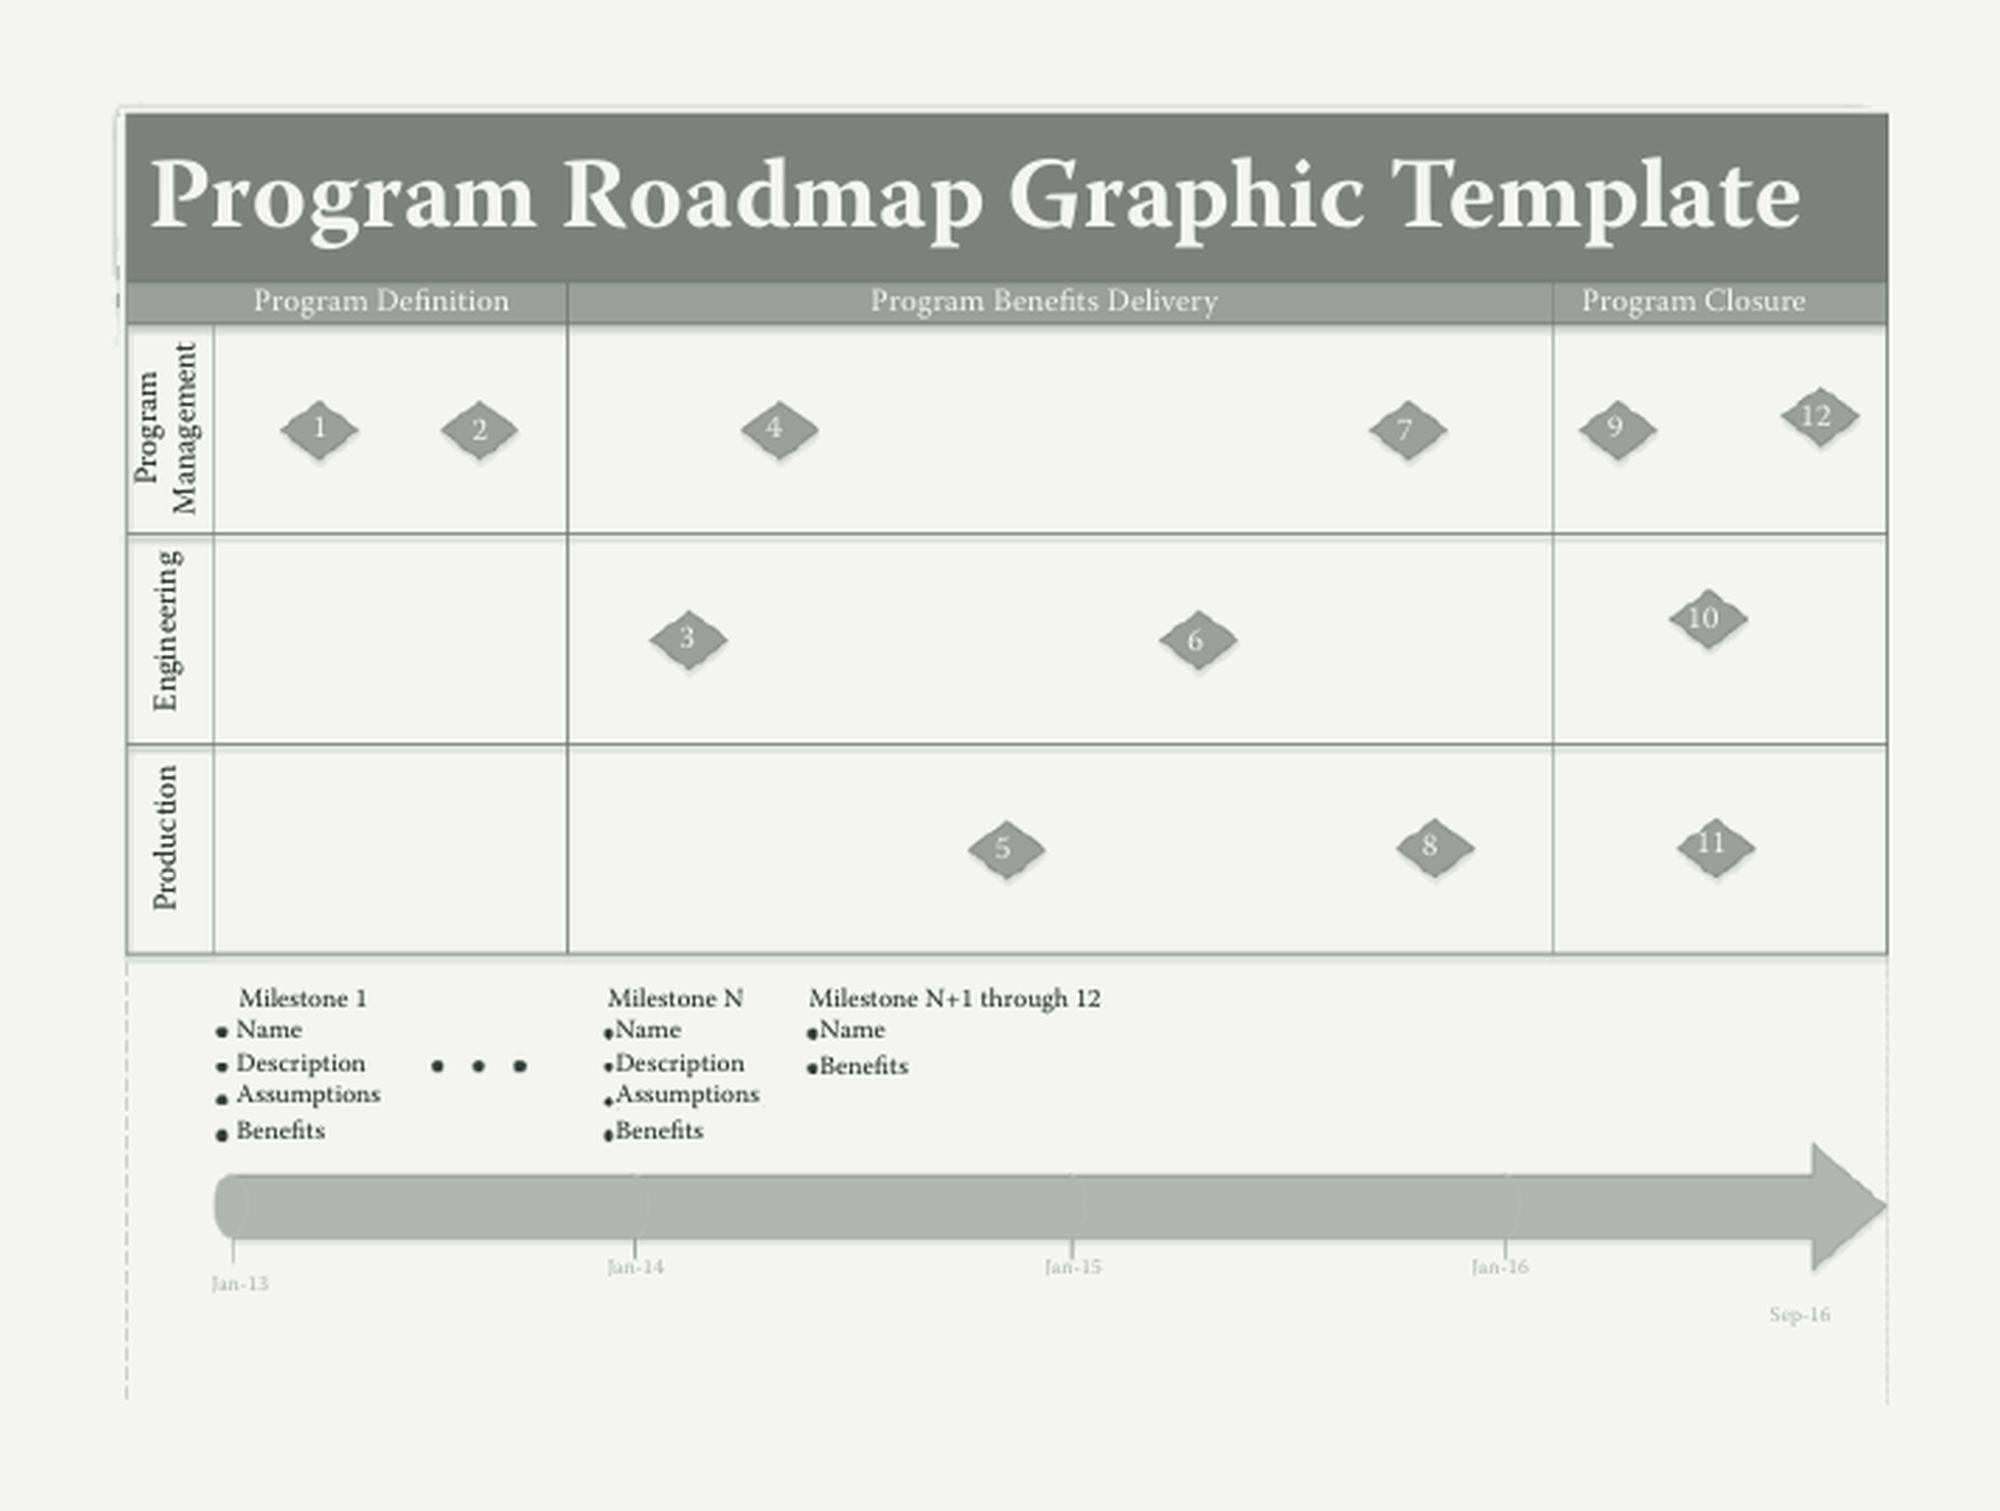
    In terms of design approach, the example program roadmap of related articles in this collection of
the Standard for Program Management—Third Edition (2013) exhibits several good
design characteristics:
   1. It provides a long-term view of the program’s milestones.
   2. It gives more detail about n  ear-term milestones.
   3. It gives much more condensed information on longer-term milestones.
   3. Multiple swim lanes provide a coordinated overview of program areas.
   4. Milestones illustrate benefit achievement among other aspects.
See the graphic, which follows, as an approach to consider.

      Program Roadmap Graphic Template
                        Program Definition                          Program Benefits Delivery                    Program Closure
    Management
     Program

                             1         2                   4                                    7                 9            12
      Engineering

                                                      3                                    6
      Production

                                                                              5                     8                   11

                      Milestone 1            Milestone N       Milestone N+1 through 12
                      Name                   Name              Name
                      Description            Description       Benefits
                      Assumptions            Assumptions
                      Benefits               Benefits

                                             Jan-14                               Jan-15                Jan-16
                    Jan-13
                                                                                                                             Sep-16
Program Roadmap Diagramming

A useful roadmap presents the whole program at a glance while deliberately varying detail by horizon. Near-term commitments can be explicit; distant work should be condensed and shown with the uncertainty it still carries. Swim lanes coordinate major program areas, while milestone and benefit markers make the path to value visible.

How to use it

Define the decision the roadmap must support and the audience that will use it. Establish the time horizon and the program phases, then create swim lanes for major components, capabilities or accountable groups. Add only material milestones, dependencies, benefit transitions and governance gates.

Build the visual from a reliable source of program data wherever practical. Assign an owner and update cadence, reconcile the roadmap with detailed schedules and benefit plans, and record assumptions behind distant milestones. Review the roadmap in governance meetings as a decision surface: highlight movement, emerging conflicts, benefit risk and changes to the critical sequence.

Keep the near term more detailed than the distant horizon. Use visual hierarchy consistently, label uncertainty rather than implying false precision, and archive dated versions so stakeholders can see how the program’s path has evolved.

Top practical tip

Design the roadmap around a small number of governance decisions, then connect its objects to owned source data. This keeps updates efficient and makes every milestone, dependency and benefit marker traceable to the team responsible for it.

Top pitfall

Do not let the roadmap become decorative certainty. If it is detached from component schedules, benefit evidence, accountable owners or explicit assumptions, its clean visual sequence can conceal rather than clarify program risk.

Further reading

  • Project Management Institute (twenty twenty-four). The Standard for Program Management. Project Management Institute.
  • Project Management Institute (twenty eighteen). Benefits Realization Management: A Practice Guide. Project Management Institute.