
keymodels
Menu
StrategyFramework / modelModelAccessible

The suns & clouds chart

How can the suns & clouds chart support strategic choice or positioning?

AccessibleStrategicProgram / project2 min read
Contents

Strategic due diligence (‘SDD’), which we met in the previous tool, seeks to address the balance of risk and opportunity in meeting your plan.

The Suns & Clouds chart balances the important opportunities and risks behind a strategy. It is a visual output of strategic due diligence rather than a threat-only register.

When to use it

  • Use the chart for acquisitions, alliances and investments, or adapt it to project appraisal, strategy review, career choices and other decisions where upside and downside must be compared.

Origins

I created the Suns & Clouds chart during consulting work in the early nineteen-nineties as a way to communicate strategic due diligence on one page. Variants later appeared in other consulting reports because the visual vocabulary makes relative likelihood and impact immediately discussable.

What it is

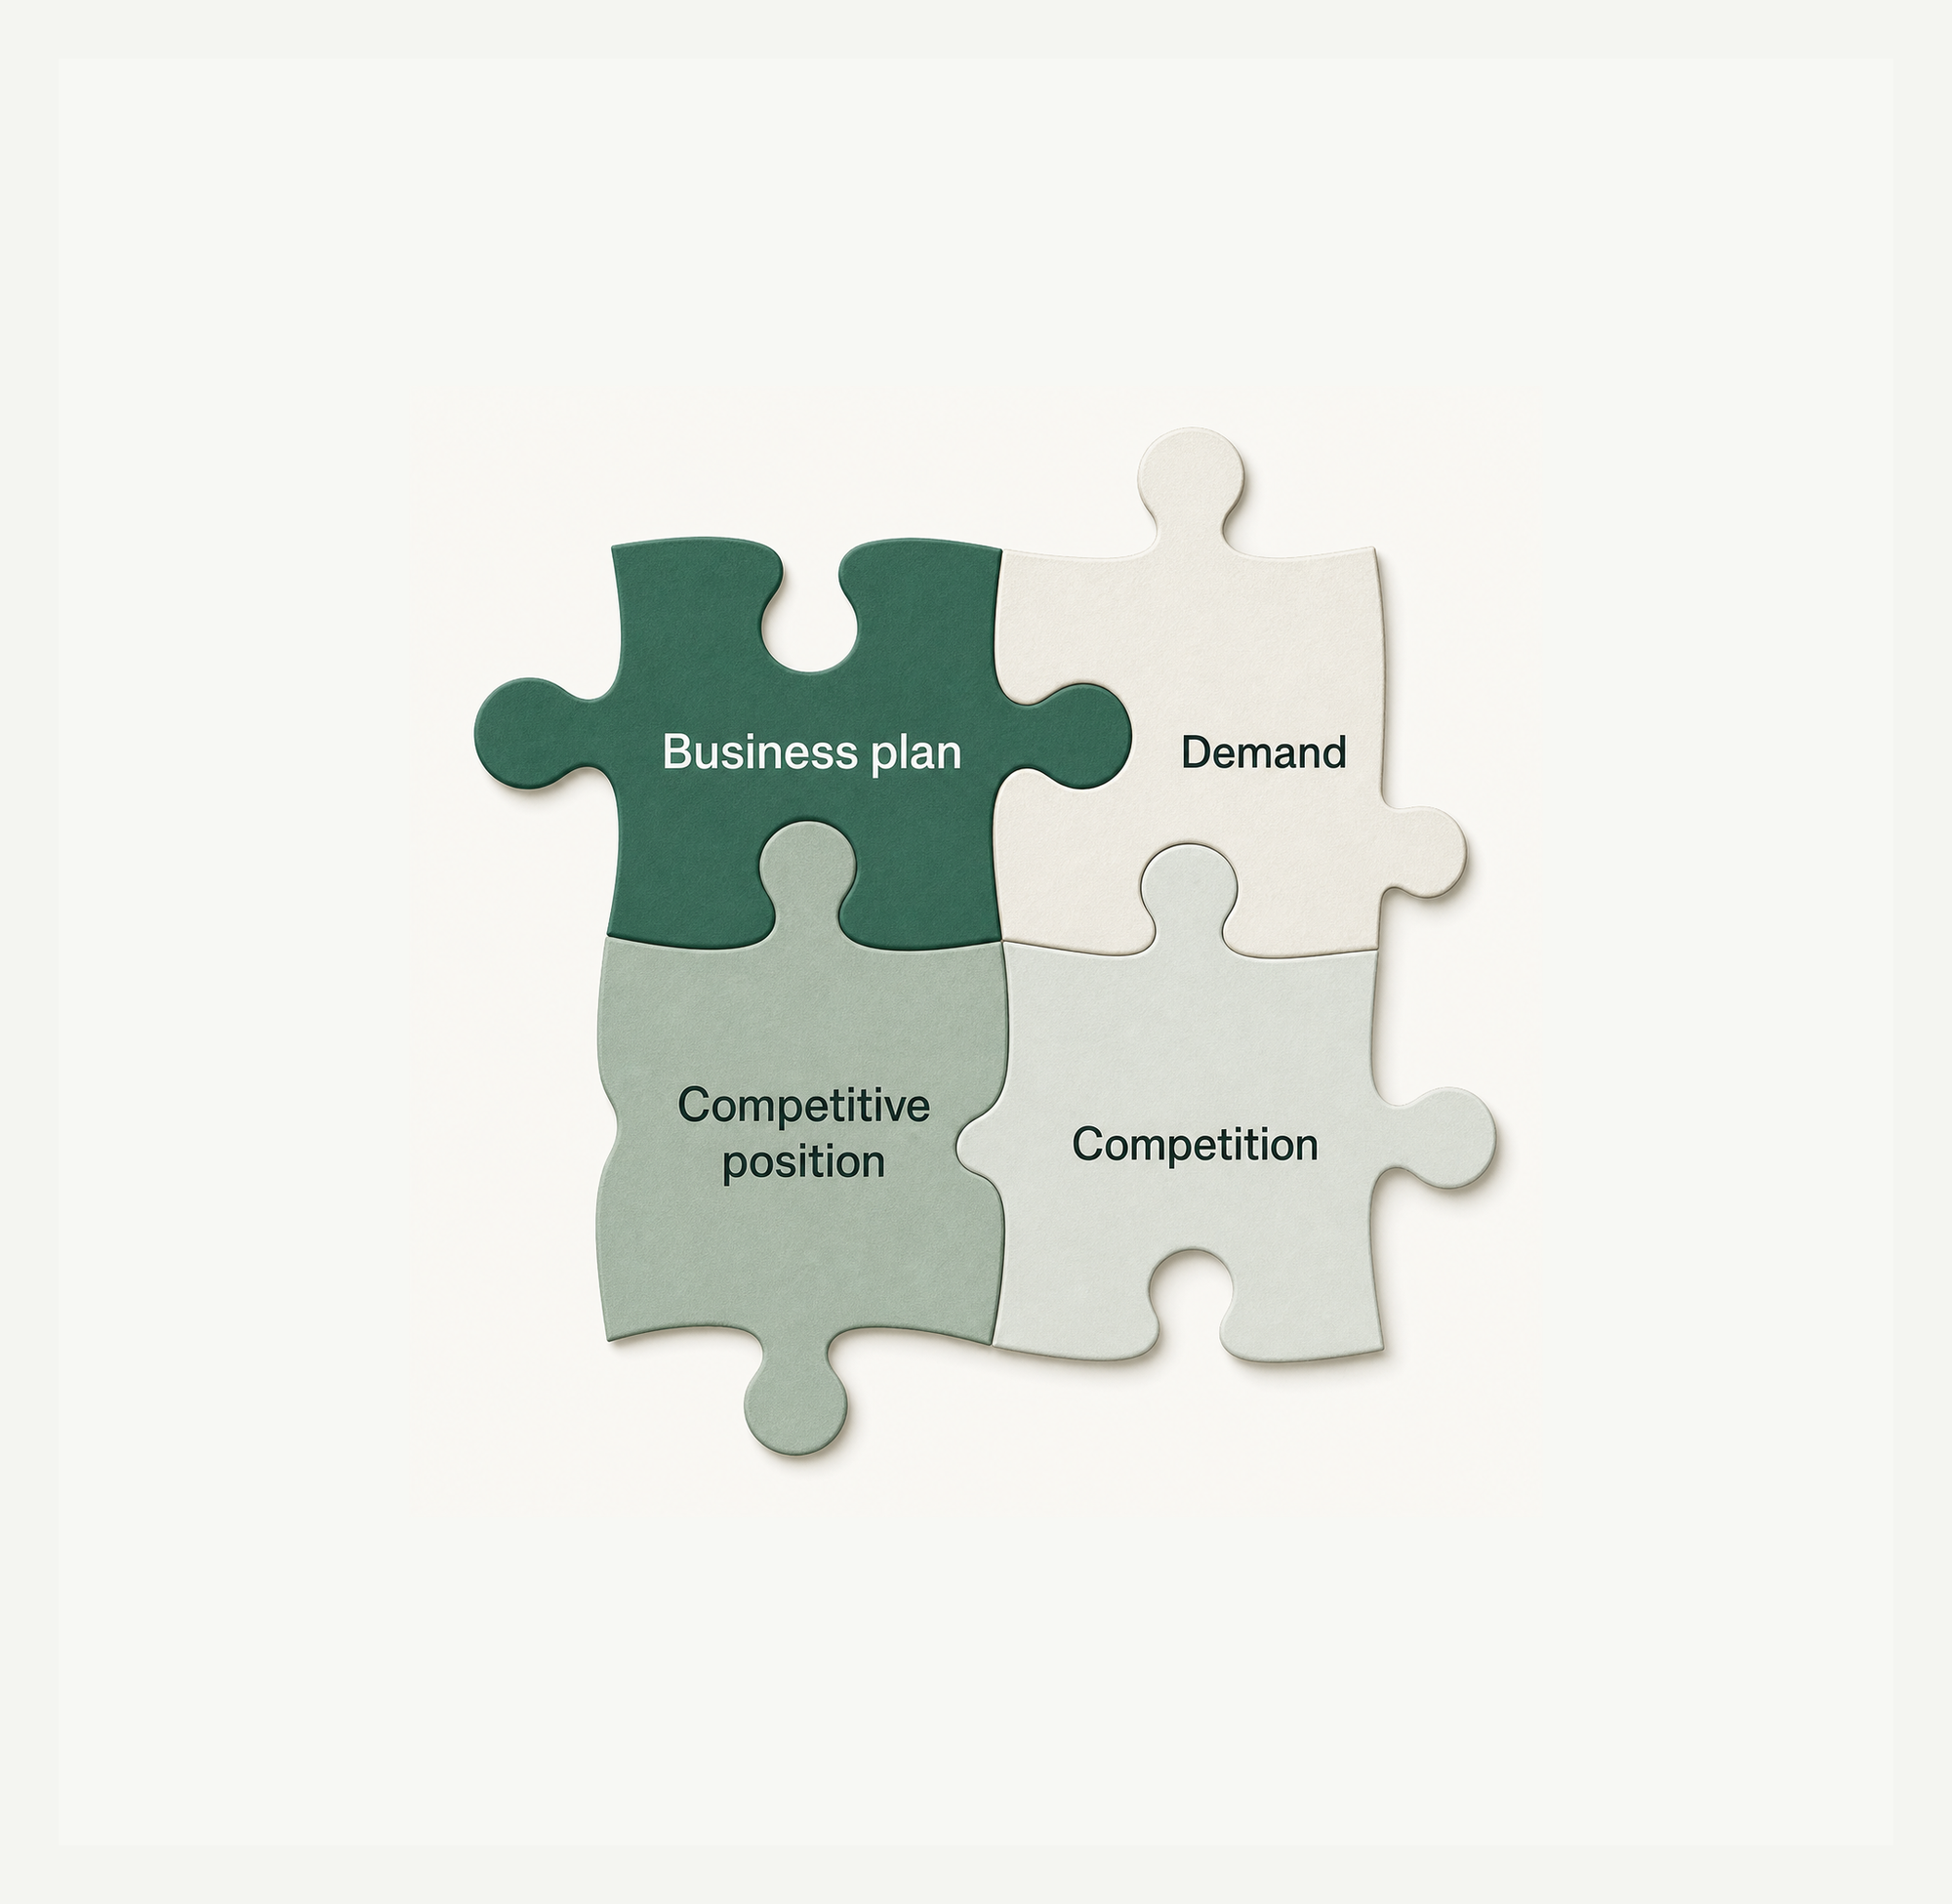
The chart assembles four areas of uncertainty:

  • Demand: Could future market demand fall short of or exceed the forecast?
  • Competition: Could rivalry, entry, substitution or market structure develop differently?
  • Competitive position: Could the company’s relative strength weaken or improve?
  • Business plan: Could strategic choices and implementation underperform or outperform?

The risk jigsaw of strategic due diligence
The suns & clouds chart

For each area, identify the main negative and positive departures from the plan. Estimate how likely each is and how materially it would affect value. Together they form a ‘risk jigsaw’ that tests whether the plan is backable.

How to use it

Gather the evidence already developed for market demand, industry competition, competitive position and strategy execution. Convert broad concerns into distinct events with causes and consequences.

The Suns & Clouds chart

The suns & clouds chart

Key Market risks

Internal risks

Opportunities

Plot risks as clouds and opportunities as suns. Horizontal position reflects likelihood; vertical position reflects relative impact on value. Exact quantification is not required, but the placements must be consistent enough to compare issues.

Read the chart in two ways:

  • Extraordinary events: A cloud near the high-likelihood, high-impact corner is a potential show-stopper. The strategy needs redesign, protection or rejection. A sun in the same area represents unusually strong upside.
  • Overall balance: Concentrate on the issues above the diagonal, where likelihood and impact are both material. Determine whether the important suns outweigh the important clouds and whether the remaining downside is acceptable.

Then make the chart dynamic. Show risk-mitigation actions with arrows towards lower likelihood or impact, and opportunity-enhancement actions towards stronger upside. External demand and competition may be difficult to influence, while competitive-position and implementation risks are often more manageable.

Assign owners, evidence and review dates. Redraw the chart as discussion improves definitions or new evidence changes placement; iteration is a feature, not a failure.

Top practical tip

Inspect the high-likelihood, high-impact corner first, then compare the complete pattern of material suns and clouds before backing the strategy.

Top pitfall

Do not force immediate consensus around the first draft. Refine events and placements as evidence and discussion improve.

Further reading

  • Howson, P. (two thousand and three). Due Diligence: The Critical Stage in Mergers and Acquisitions. Gower.
  • Courtney, H., Kirkland, J. and Viguerie, P. (nineteen ninety-seven). “Strategy Under Uncertainty.” Harvard Business Review.