 keymodels
Customer journey mapping
How can customer journey mapping support strategic choice or positioning?
Contents
Customer journey mapping is a model for mapping all interactions between customers and the organisation from the perspective of the customer, with the intention of.
Customer journey mapping visualises a customer’s goals, actions, touchpoints, thoughts and emotions across an end-to-end relationship. It helps the organisation improve experience and sales while coordinating the online and offline processes that produce them. The method has existed since the late 1980s and became more prominent as social media and e-commerce multiplied channels.
When to use it
Use it to diagnose a current service, design a better future journey, train customer-facing teams or prioritise investment. The map can expose opportunities to improve experience and reduce service cost, provided efficiency does not remove something customers value.
Journey evidence can also reveal unmet needs and future business opportunities, making it an input to strategy as well as service improvement.
Origins
Customer journey mapping has no single inventor. G. Lynn Shostack’s mid-nineteen-eighties Harvard Business Review article “Designing Services That Deliver” introduced service blueprinting, a clear precursor connecting visible experience with frontstage and backstage operations. During the 1990s and 2000s, service-design, user-experience and customer-experience practitioners increasingly mapped goals, touchpoints, emotions and pain points across channels.
What it is
A journey map is a research-based representation of experience from the customer’s perspective. It includes what happens, what the person is trying to achieve and how the experience feels, then connects that evidence with improvement opportunities.
How to use it
Define the customer or segment, scenario, start and end before mapping. Include people with first-hand customer contact and use direct research, behavioural data, complaints and satisfaction surveys rather than relying on internal memory.
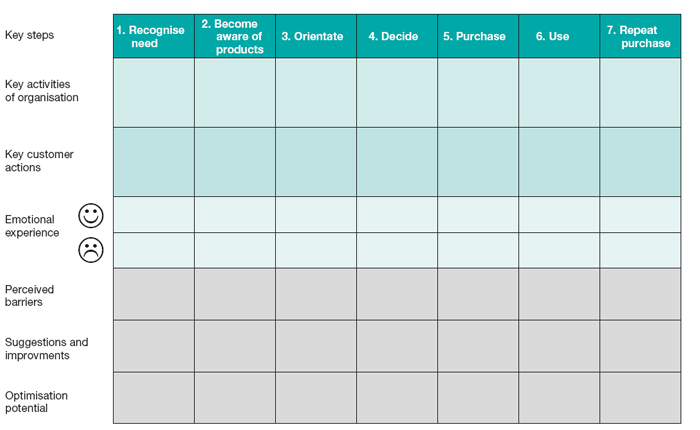
Break the scenario into steps. At each step record customer action, organisational action, touchpoint, channel, evidence, emotion and barrier. Investigate negative emotion against expectations, effort, value and the processes that created it. Examine positive emotion as carefully: determine what caused it, why it rises or falls at the next step and whether the mechanism can transfer elsewhere. This supports conversion analysis as well as experience improvement.
Convert each important pain point or positive moment into an opportunity, responsible owner, measure and test. Prioritise by customer impact, business value, feasibility and risk.
Let customer-defined steps lead the visual. A practical map can contain:
- Chronological steps the customer experiences.
- Organisational activities supporting each step.
- Customer actions, with touchpoints highlighted where both sides interact; not every step contains one.
- Thoughts, feelings and satisfaction, often shown as a customer-experience or heartbeat line.
- Structural, process, cost, implementation and other barriers to progress.
- Changes that improve satisfaction or make transition easier.
- Savings from removing inefficiency, merging overlap or eliminating unnecessary activity without harming the outcome.
Final analysis
The model spans physical and digital interaction, tangible products and intangible services. Its dual lens can improve customer outcomes and sales while reducing avoidable cost and increasing margin.
It scales from a sales-team working session to a board-level programme supported by extensive research, although the confidence attached to the map should match the evidence.
Visual clarity helped make journey mapping popular in e-commerce. The path need not be linear: a wheel can connect after-sales activity with orientation for the next or replacement purchase. This circular form is also called a customer-activity cycle; Lego’s customer-experience wheel is a well-known example. Real journeys may loop, pause, switch channels or end, so the visual must follow evidence rather than aesthetic convenience.
Top practical tip
Use the map in training and investment reviews, but attach evidence and an owner to every major pain point so empathy leads to operational change.
Top pitfall
An internally imagined workshop map is only a hypothesis. Validate it with direct customer and behavioural evidence, including abandoned, failed and non-linear journeys.
Further reading
Liedtka, J., Ogilvie, T. and Brazonske, R. (2013) The Designing for Growth Field Book: A Step-By-Step Project Guide. New York: Columbia Business School Publishing.
Richardson, A. (2010) ‘Using customer journey maps to improve customer experience’. HBR Blog Network (posted 15 November 2010). http://blogs.hbr.org/2010/11/using-customer-journey-maps-to/.
Shostack, G.L. (1984) ‘Design services that deliver’. Harvard Business Review (84115), 133–139.